Boost Your Business Ratings and Revenue

Transform your online presence with expert analytics and actionable insights.

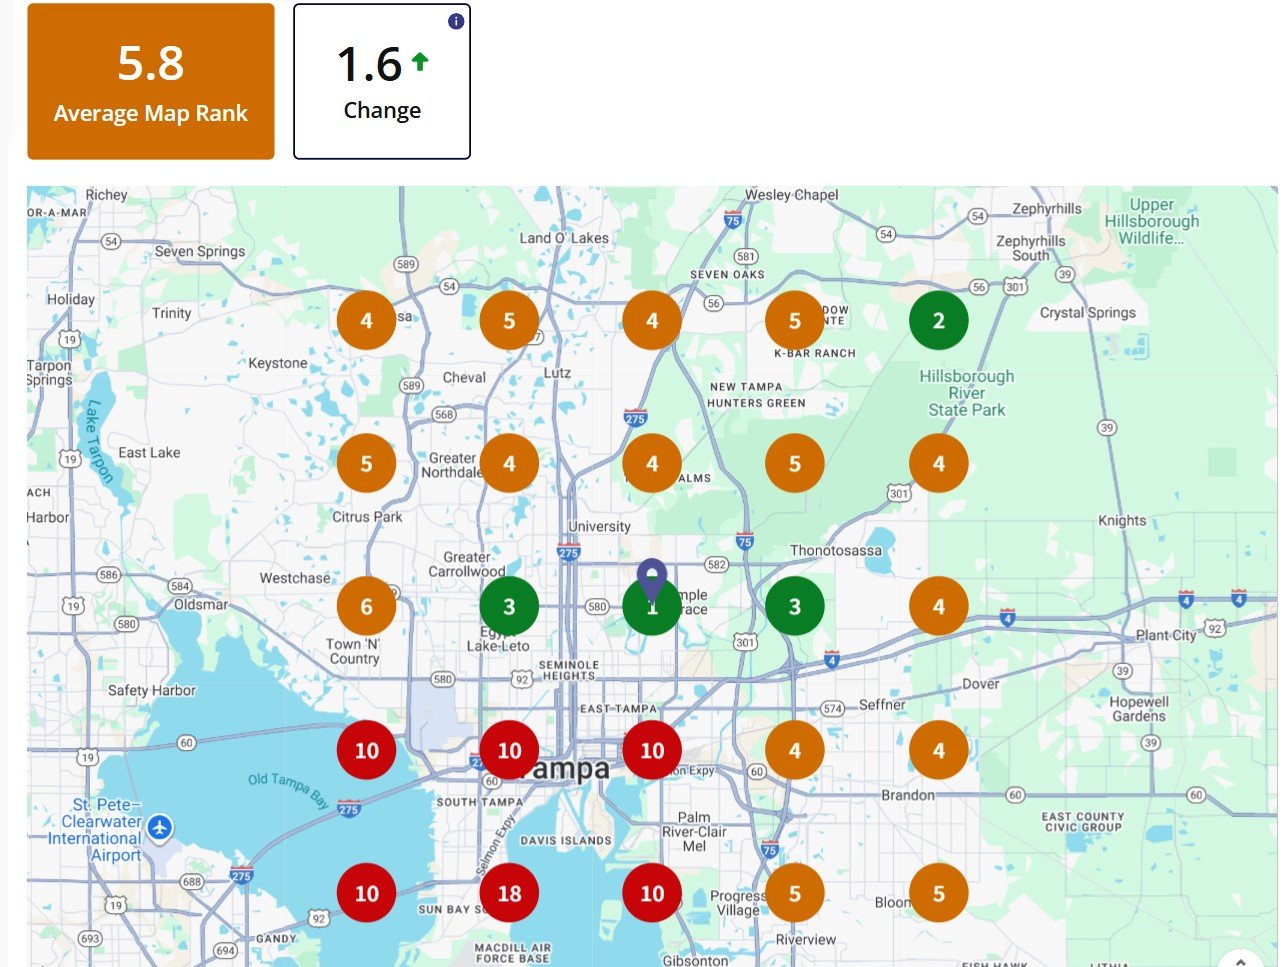
Enhance star ratings through data-driven strategies.

Do you have long wait times. Optimize staffing for improved operational efficiency.

Improve Your SEO to outshine your competitors.

A digital dashboard displaying various analytics charts and graphs. There is a line graph showing user engagement over time on the left, a section with total revenue marked as $74K, and bar charts illustrating user statistics by region. The central section highlights users in the last 30 minutes, focusing on different countries such as the United States, Canada, India, Pakistan, and Brazil.
A computer screen displaying analytics dashboards with various charts, including a line graph on the left and a cohort analysis table on the right. The table is populated with different shades of blue, indicating varying levels of user activity over several weeks. Text labels and numbers detail user retention statistics.
A computer screen displaying a data analytics dashboard with graphs and charts. A blue line graph shows fluctuations in data over time, and a section highlights the number of page views. A pie chart is partially visible, indicating a breakdown of different data elements.

Empowering Businesses Through Analytics

At Valuelytics, we enhance your star ratings and revenue through expert analytics and actionable insights tailored to your business needs. Our solutions go beyond surface-level improvements. We analyze your customer feedback, identify key trends, and provide strategies that directly impact your bottom line.

By leveraging advanced analytics and customer-focused recommendations, we empower businesses to create exceptional experiences, attract more 5-star reviews, and drive sustained growth.

A laptop with an open screen displaying dashboard analytics featuring charts, graphs, and numerical data related to sales and subscriptions. The interface is predominantly dark-themed with sections highlighting key performance metrics. The device shown is a MacBook Pro, indicated by the keyboard layout and branding.

90+

12

Trusted by Clients

Proven Results

Consulting Services Overview

We enhance business performance, boosting revenue through data-driven insights and effective optimization strategies.

Performance Analytics Solutions
A person is holding a smartphone displaying an analytics or insights screen with various metrics and numbers. The individual is wearing a casual white shirt and a watch with a black band. The surrounding environment includes an indoor plant.

At Valuelytics, we help you transform customer reviews into a goldmine of actionable insights. By analyzing feedback trends and identifying both strengths and areas for improvement, we create strategies that directly enhance your star ratings and drive positive business outcomes. Whether it's addressing recurring concerns, highlighting unique selling points, or refining customer experience, our insights ensure that every review serves as a stepping stone toward growth and excellence.

A computer screen displaying an analytics dashboard with metrics such as event activity, showing a current value of 4.7k for today's activity. There are graphs indicating trends and peaks in the data, as well as labels for different types of events.
A person is looking at a computer screen displaying a document titled 'Overview - All Private Equity - Fundraising, Investments, & D'. The document contains statistical charts and graphs related to private equity market statistics from 2007 to 2022. Various tabs and functions like 'File', 'Home', 'Insert', and 'Design' are visible in the interface.
Operational Efficiency

At Valuelytics, we empower businesses to optimize staffing and forecasts, ensuring they stay competitive and efficient. By leveraging advanced analytics and data-driven insights, we help you align workforce capacity with customer demand, reducing costs and improving service delivery. Whether it’s adjusting schedules to meet peak times or forecasting future needs with precision, our tailored solutions streamline operations and position your business for sustainable success.

At Valuelytics, we specialize in SEO optimization services that drive traffic and amplify your online presence. By conducting in-depth keyword research and enhancing on-page and off-page SEO, we help your business rank higher in search engine results. Our strategies focus on improving website speed, mobile usability, and content relevance, ensuring your customers find you when they need you most. With our expertise, you can attract more qualified leads, enhance credibility, and stay ahead of the competition in today’s digital landscape.

Expert SEO Optimization
woman wearing yellow long-sleeved dress under white clouds and blue sky during daytime

Valuelytics transformed our online presence, significantly improving our star ratings and increasing revenue effectively.

William Paredes

A smartphone displays analytics data with graphs showing views, downloads, and likes. It is resting vertically on a white dock next to a small potted succulent plant. In the background, a large computer monitor is partially visible, along with a closed laptop and a white wireless earbud case.

The actionable insights provided by Valuelytics helped us enhance customer satisfaction and boost our profits.

Jason Szabo

An abstract, pastel-colored, 3D-rendered representation of data analysis and search engine optimization (SEO). The image features a computer interface with various analytics symbols, including a magnifying glass, bar charts, pie charts, and a search bar with the text 'SEO'. Surrounding the interface are different objects such as a potted plant, a cup with a saucer, and a megaphone, all placed on a light green background.
★★★★★
★★★★★